
SciChartPerformanceOverlay is a lightweight heads-up display (HUD) that connects to a SciChartSurface and displays live rendering performance (FPS and frame timing) together with a rolling FPS chart and an optional total points counter. It helps you validate and tune performance in streaming, FIFO, or heavy-interaction scenarios.
How it works
SciChartPerformanceOverlay attaches to a target chart (SciChartSurface) via the TargetSurface property. On attach, it hooks the Surface’s Loaded/Unloaded events and subscribes to two render events:
- WPF frame tick through the CompositionTarget.Rendering event, that measures WPF render passes.
- SciChart render tick through the SciChartSurface.Rendered event, that is fired every time SciChartSurface is redrawn.
Also, it uses a Stopwatch to compute per-frame FPS and draws a rolling series on a chart.
How to use it
SciChartPerformanceOverlay can be attached to a SciChartSurface with WPF Binding. The code snippet below shows how to use ‘ElementName’ binding for that purpose:
| Adding SciChartPerformanceOverlay |
Copy Code |
|---|---|
<Grid> <!-- Your main chart --> <s:SciChartSurface x:Name="MainChart" s:VisualXcceleratorEngine.IsEnabled="True" /> <!-- Performance HUD --> <s:SciChartPerformanceOverlay TargetSurface="{Binding ElementName=MainChart}" HorizontalAlignment="Right" VerticalAlignment="Top" Margin="8" Padding="8" Background="#33000000" Foreground="White" FontWeight="Bold" IsHitTestVisible="False"/> </Grid> | |
Styling & templating
You can redefine the SciChartPerformanceOverlay template to achieve desired layout:
- Reorganize the layout (e.g., stack FPS labels, add an inline SciChartSurface to plot WpfFpsSeries)
- Bind text labels to WpfFps, SciChartFps, and TotalPointCount properties
- Toggle a mini-chart panel via the ChartsVisibility porperty
Where to find examples
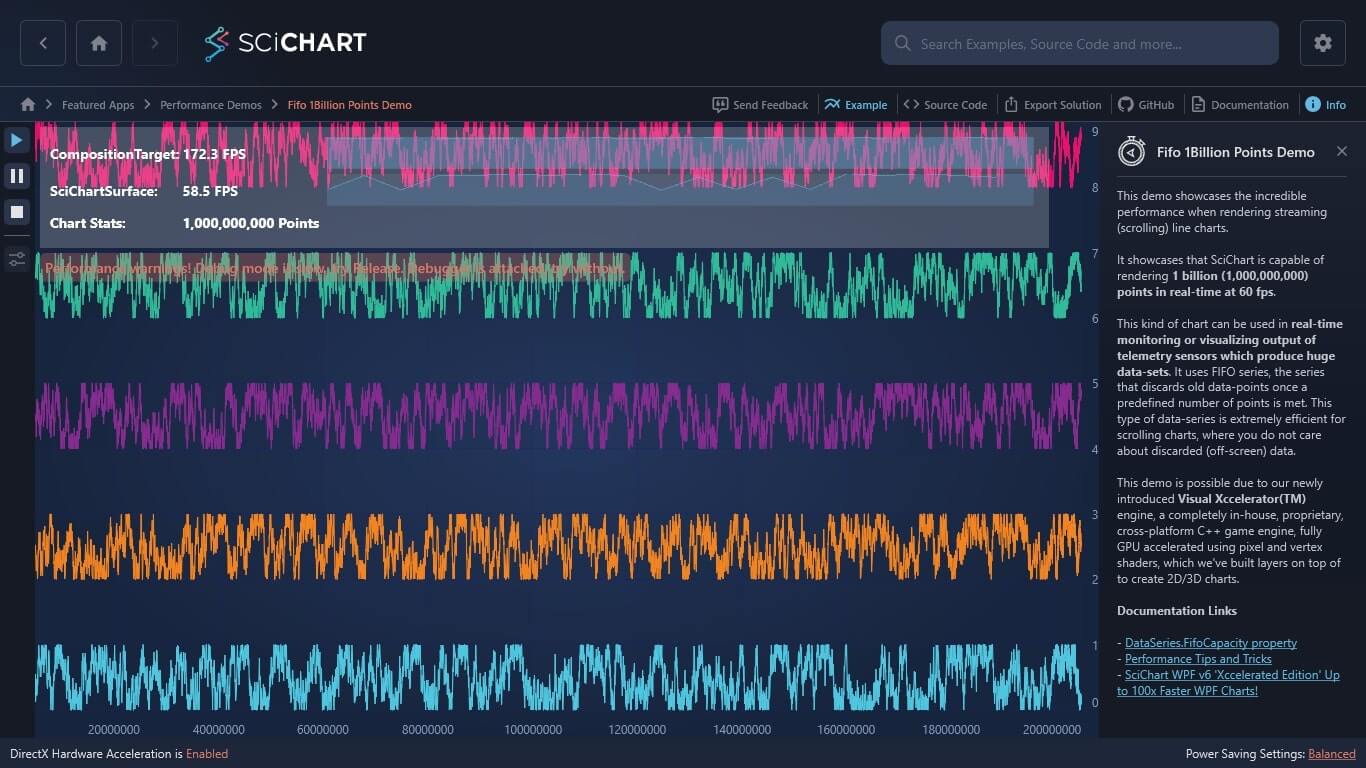
It’s used extensively in SciChart’s performance demos to surface metrics such as FPS (frames per second) and frame timing while charts are updating at high data rates. The overlay helps you verify performance targets (e.g., ~60 FPS) and quickly spot bottlenecks during development and tuning.
Typical uses:
- Realtime/FIFO charts (telemetry, oscilloscopes) to confirm sustained FPS
- Stress tests for real-time charts with large point counts
- Measuring the impact of modifiers, styling, and GPU/DirectX settings
You can see it in action in the FIFO 1 Billion Points Demo and other Performance Demos / Featured Apps. In those pages the overlay is placed over the chart surface to show FPS as data streams.
Troubleshooting
- Overlay shows zero or NaN FPS: ensure the main chart (SciChartSurface) is actually rendering anything (data present or interactions occurring) and that the SciChartPerformanceOverlay is attached to it
- High WPF FPS but lower SciChart FPS: your app’s UI may be light while the chart is the bottleneck (e.g., enormous point counts or many series)
- Lower WPF FPS than SciChart FPS: heavy UI activity (animations, other controls) can limit the overall frame rate